
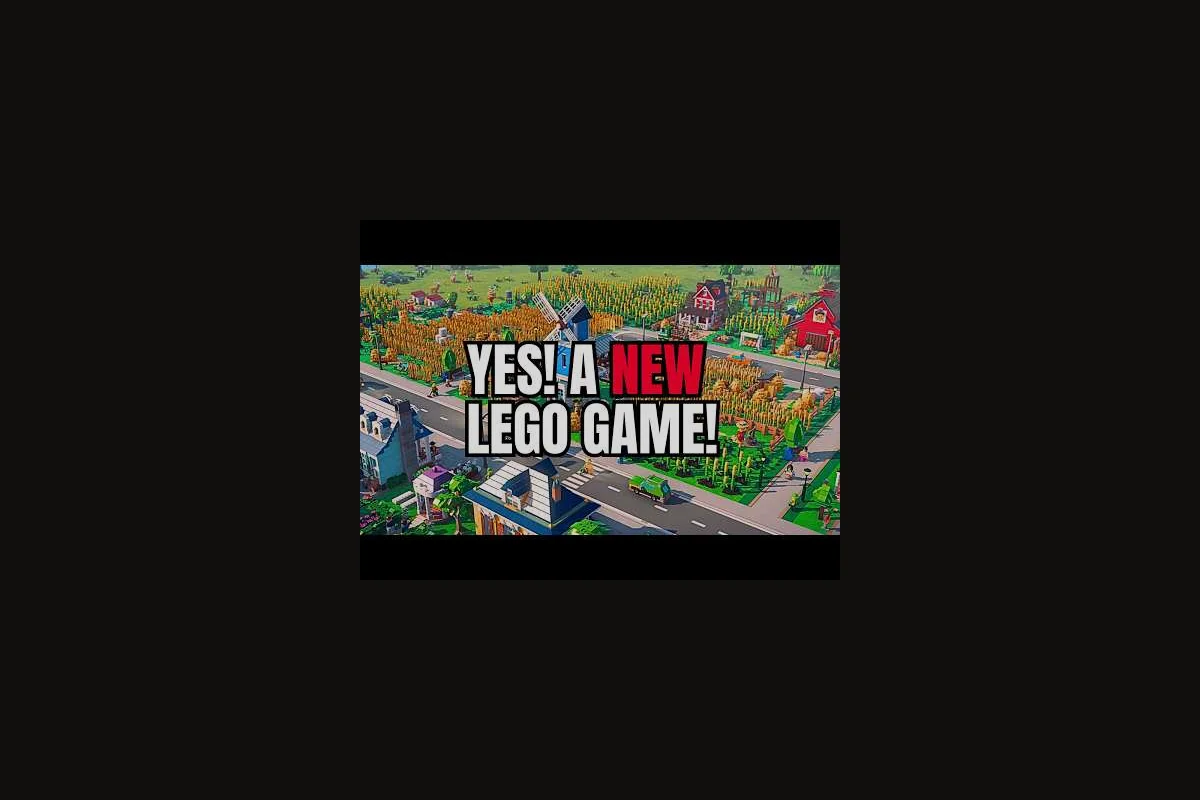
Good LEGO Skylines service planning turns a sprawling LEGO brick metropolis from a gridlock of stalled trucks into an efficient city where every minifigure finds a job, a clinic, and a park without a long wait. According to the official Paradox Interactive page, the title layers electricity, water, food, housing, jobs, healthcare, parks, shops, waste collection, and sewage on top of one another, which means a single misjudged service radius ripples through every other system. This guide focuses on the demand-driven approach to traffic planning, showing you how to read citizen needs, stage utility placement, and avoid the chokepoints that strangle even the prettiest downtown block.
Reading Citizen Demand Before Placing Buildings
LEGO Skylines service planning works best when the city tells you what it needs, and the Citizen Demand panel is the most direct way to listen. Instead of guessing whether the next block deserves a fire station or a clinic, you watch the demand bars rise and fall as population changes, because each service category is a living scoreboard that reacts to zoning, employment, and accessibility.
The smartest move is to keep the panel pinned to a corner of the screen and check it every time you finish a major road or zoning change. The data flows from the same Demand Simulation engine that drives the LEGO Skylines Steam page description, which confirms services are "interconnected" rather than isolated toggles. Treat demand as a continuous conversation, not a checklist.
Understanding the Demand Categories
| Service Category | What Demand Tracks | Common Trigger | Default Time to Spike |
|---|---|---|---|
| Healthcare | Sick citizens, low hospital coverage | New residential block aged 60+ days | 2–4 in-game weeks |
| Fire & Safety | Building age, fire risk | Industrial zoning without hydrants | 1–3 in-game weeks |
| Education | Child citizen share | New family housing | 3–5 in-game weeks |
| Parks & Leisure | Land value, density | Dense commercial corridors | 2–4 in-game weeks |
| Waste & Sewage | Average building trash output | Old residential without garbage trucks | 1–2 in-game weeks |
| Food & Shops | Distance to commercial goods | Isolated residential pockets | 2–3 in-game weeks |
Reading the table left to right gives you a roadmap. When Waste & Sewage demand spikes before anything else, your traffic planning problem is not ambulances but garbage trucks stuck behind a single-lane alley.
Translating Bars into Placement Decisions
Demand bars are relative, not absolute, so a yellow "high" in healthcare after a population boom is very different from a yellow bar in a city of 800 citizens. A useful rule of thumb is the one-third threshold: if a bar fills more than a third of its track, start scouting a placement site; once it crosses two-thirds, queue the building immediately or expect traffic jams from emergency vehicles circling the map.
To stay ahead, pair this rule with the Service Coverage Overlay, a visual layer that paints under-served blocks in red. When a red patch overlaps with high residential demand, the next road you lay should be the one that brings the new service building into reach. For a deeper breakdown of how the overlay interacts with parks and healthcare, the service guide for healthcare and parks is a useful companion read.
Building a Traffic-First Road Layout
A demand guide is only as good as the roads that connect demand to supply. In LEGO Skylines, every truck, ambulance, and minifigure commute funnels through the same network, so a single pinch point can cascade into citywide service delays. The traffic planning mindset is to design the road grid so that service vehicles have a route that is shorter than the citizen walk to the building they serve.
Start by laying a ring road around the first downtown cluster. Ring roads let you bypass any future chokepoint and keep heavy truck traffic on the outer edge, leaving the inner streets for citizens and service vehicles. Once the ring is in place, add radial arterials every 8–10 blocks to break the city into manageable service sectors.
Road Type Comparison for Service Routing
| Road Type | Best Use | Vehicle Capacity | Service Suitability |
|---|---|---|---|
| Two-Lane Street | Early residential blocks | Low | Emergency vehicles only |
| Four-Lane Avenue | Mixed zoning corridors | Medium | Ambulances, garbage trucks |
| Six-Lane Boulevard | Industrial clusters | High | Freight + service traffic |
| One-Way Pair | Downtown grids | Medium-High | Smooth ambulance runs |
| Pedestrian Path | Park connectors | None (foot only) | Citizens, not vehicles |
Notice that the pedestrian path sits in the table as a deliberate counter-example. It feels efficient because citizens love it, yet it pulls walkers off vehicle routes and concentrates them, which can actually slow nearby service buildings if citizens cluster around the path entrance instead of walking to the next street.
Avoiding the Classic Bottleneck
The most common mistake new players make is upgrading a single avenue to a six-lane boulevard in the middle of an existing two-lane grid. The result is a bottleneck intersection where six lanes of incoming traffic have to squeeze through a two-lane exit. Service vehicles get stuck in the same queue as commuters, and the demand for healthcare spikes purely because ambulances cannot reach the sick.
A safer alternative is the staged upgrade approach: widen the avenue one block at a time, adding parallel frontage roads so each intersection still has matching capacity on both sides. This is the same logic behind building a first-services network in tiers instead of all at once.
Matching Service Coverage to Population Tiers
Service coverage is not a single radius; it is a layered system where each tier of population unlocks more capable buildings. Understanding the tier ladder is essential to traffic planning, because oversized buildings in low-density areas burn maintenance while undersized buildings in dense blocks create queues. The table below captures the typical progression at the time of writing, based on the building families the official Steam store page lists under waste, sewage, healthcare, and parks.
Service Building Tier Reference
| Tier | Population Range | Healthcare Example | Waste Example | Footprint |
|---|---|---|---|---|
| Starter | 0–500 | Small Clinic | Trash Bin Network | Compact |
| Standard | 500–2,000 | Community Hospital | Garbage Truck Depot | Medium |
| Advanced | 2,000–8,000 | District Hospital | Recycling Center | Large |
| Specialized | 8,000+ | University Hospital | Incinerator Complex | Very Large |
A common rookie move is to drop the Advanced tier building at population 1,200 because the icon looks impressive. The build wastes money, blocks road frontage that could host housing, and does not improve coverage enough to justify its cost. Save the big box for when the demand bar at the population tier actually justifies it.
Footprint and Service Radius Trade-offs
Every upgrade in tier usually comes with a wider service radius but a larger physical footprint. The wider radius is a traffic-planning gift, because it means fewer buildings for trucks to visit on their rounds, but the larger footprint means you must plan space for it before surrounding blocks fill in. A practical habit is to reserve a 4×4 plot in every neighborhood center as the future home of the next-tier service building, and treat that reservation as untouchable until the population actually needs it.
Staging Utilities: Electricity, Water, and Sewage
Demand is the visible layer, but utilities are the silent backbone. A hospital without power is a brick statue, and a residential block without sewage is a health hazard that quickly reverses every service gain you just made. LEGO Skylines service planning therefore demands a three-stage utility plan that matches each infrastructure type to the growth phase of the neighborhood.
The first stage covers electricity and water, because both are required before any zoning becomes active. The second stage adds sewage, which is technically optional at game start but becomes mandatory once you exceed the first population tier. The third stage brings waste collection online, which is where the traffic planning lessons from the previous sections earn their keep, because garbage trucks are the heaviest vehicle on the road.
Utility Staging Checklist
-
Stage 1 — Electricity and Water: Lay a single power plant and a single water tower near the first residential cluster, then expand along the ring road as new blocks come online.
-
Stage 2 — Sewage: Add a sewage outflow pipe downstream of the residential area, because outflow efficiency drops sharply when pipe length crosses 80% of its maximum capacity.
-
Stage 3 — Waste: Place the first garbage depot within range of the densest residential cluster; the LEGO Skylines Steam listing highlights waste collection as a discrete service, so treat it as a first-class citizen in your plan.
Common Utility Pitfalls
| Pitfall | Symptom | Fix |
|---|---|---|
| Single power plant serving the whole city | Rolling blackouts | Add a second plant on the opposite side of the map |
| Water towers uphill of housing | Low pressure complaints | Place water infrastructure on high ground with gravity feed |
| Sewage pipe looping back to source | Flow reverses | Run outflow downhill and away from the water intake |
| Garbage depot at map edge | Long truck routes | Move the depot closer to the densest residential block |
A reliable Efficient City indicator to watch is the average citizen commute time. If commute time climbs while population holds steady, the bottleneck is almost always a road or a service truck route, not a missing utility. That single metric ties the utility staging back to the traffic planning goal, because every minute a service vehicle spends in traffic is a minute a citizen spends waiting.
Scaling Into Industrial and Commercial Demand
Once the residential base is stable, the next demand guide challenge is balancing workplaces and commercial demand without strangling the road network. Industrial zoning produces freight, commercial zoning produces shoppers, and both generate service traffic in opposite directions. A naïve grid forces them to share the same arterials, which is where the efficient city vision falls apart.
The cleanest pattern is a split sector layout, where industrial sits on one side of the ring road and commercial sits on the other, with residential in the middle. Trucks leave industry via dedicated freight roads, shoppers reach commercial blocks via pedestrian-friendly avenues, and emergency services cut straight through the center. The result is a city where each vehicle class has a preferred lane, and traffic jams become rare enough to debug.
Industrial vs. Commercial Service Needs
| Aspect | Industrial | Commercial |
|---|---|---|
| Primary demand driver | Freight trucks | Customer footfall |
| Key service | Fire stations, waste | Healthcare, parks |
| Peak traffic hours | Early morning | Late afternoon |
| Sensitive to bottlenecks | Very high | Moderate |
| Best road partner | Six-lane boulevard | Four-lane avenue |
Notice that fire stations are the top service need for industry. Industrial buildings age faster, store flammable materials, and have less redundancy, so a fire in a factory can idle a whole sector if the nearest truck is stuck across the river. Place fire stations on the industrial side of the ring road, not in the residential center, even if the residential demand bar looks more urgent at first glance.
Coordinating the Freight Network
The freight network is the unsung hero of the efficient city. Trucks do not care about scenic parks or pretty brick plazas, so do not force them through downtown. Instead, give them a freight bypass that runs along the outside of the industrial sector and connects directly to the highway off-ramp. Citizens never see the trucks, trucks never fight commuters, and the service network stays uncluttered. For a step-by-step walkthrough of the build order that supports this layout, the build order guide offers a parallel playbook.
Demand-Planning Traps and How to Recover
Even experienced mayors fall into the same traps, because LEGO Skylines hides feedback behind layers of menus. The mistakes below appear again and again in community reports, and each one is reversible if you catch it before the demand bar maxes out.
Mistake 1: Reacting to Demand Instead of Anticipating It
Reacting to demand is the most natural impulse, and the slowest path to an efficient city. By the time the healthcare bar is red, the sick citizens have already impacted nearby commercial land value, and the lost tax income will slow every other project. A better rhythm is to scan the panel every time you finish a new block, queue the next service building before demand is high, and let trucks pre-position near the future hotspot.
Mistake 2: Ignoring the Pedestrian Path
Pedestrian paths feel like a free upgrade to citizen happiness, but they pull walkers off vehicle roads, concentrate them, and often create a queue at the next crosswalk. They also break the natural service radius because a service building behind a pedestrian-only plaza is harder for trucks to reach. Limit pedestrian paths to park connectors, not main arterials.
Mistake 3: Building One Mega-Service
The temptation to solve the whole map with one enormous hospital is strong, but the service radius penalty in LEGO Skylines is steep at the top tier. A single mega-service leaves the opposite corner of the map in permanent under-coverage, and the trucks that do serve it burn so much time on the road that response averages climb. A network of three to five mid-tier buildings, each covering a clear sector, almost always outperforms one giant structure. The service guide expands on this network thinking for parks and healthcare combinations.
Mistake 4: Forgetting Maintenance
Every service building has a maintenance cost that climbs with tier, and that cost comes straight out of the budget. A common recovery is to demolish the oversized building and replace it with two smaller ones in better positions, because two smaller buildings usually cover the same radius for less monthly upkeep. Always check the maintenance tooltip before upgrading.
Quick Recovery Table
| Mistake | Early Warning | Recovery Action |
|---|---|---|
| Late reaction | Demand bar in red | Pre-queue next service building |
| Pedestrian path overuse | Walkers stuck at crossings | Convert to avenues with sidewalks |
| One mega-service | Long truck routes | Replace with sector network |
| Maintenance overspend | Monthly deficit | Downgrade oversized buildings |
| Bottleneck intersection | Slow service vehicles | Widen both sides of the intersection |
If you treat the recovery actions as new habits rather than patches, the mistakes stop happening in the first place, which is the cleanest path to a truly efficient city.
Advanced Tactics for Long-Term Traffic Flow
Once the basics click, the next layer of LEGO Skylines service planning is anticipatory design, where you build the road, the utility, and the service building in the correct order so the city never experiences a brownout or a truck jam. Anticipatory design rests on three habits, each of which ties demand to traffic in a different way.
Habit 1: Place the Next Service Before the Last One Fills
Every service building has a soft cap on simultaneous visitors, and the average wait time panel is the cleanest way to spot it. If average wait is creeping up, the next building should already be on the build queue. This is the single biggest difference between a reactive mayor and a planner, and it is also where the demand guide loop closes back into service planning cleanly.
Habit 2: Use Roundabouts to Smooth Service Junctions
A well-placed roundabout is a traffic engineer's cheat code, because it eliminates the red-light cycle that would otherwise block ambulances and garbage trucks. Place roundabouts at the four-way junctions where service arterials meet the ring road, and reserve traffic lights for residential intersections where citizens, not trucks, are the priority. The result is a network where service vehicles glide through and citizens still get safe crossings.
Habit 3: Monitor the Service Coverage Map Weekly
The in-game week in LEGO Skylines is short, and demand shifts faster than a casual mayor can track. Build a habit of opening the service coverage map at the start of every week, even when the city looks healthy, because the map catches problems before the demand bars do. Combine it with a quick glance at the traffic overlay, and you will spot every chokepoint before the trucks do.
Anticipatory Design Weekly Loop
| Day | Action | Output |
|---|---|---|
| Monday | Open demand panel, log top three bars | Service build queue updated |
| Wednesday | Walk the ring road, widen any 90%+ arterials | Road capacity +20% |
| Friday | Check coverage overlay, place next-tier services | Under-served blocks drop |
| Sunday | Review budget, downgrade any oversized service | Monthly income stabilized |
The loop is light on time, heavy on data, and it scales with the city because every action feeds the next. As your population climbs, the loop automatically generates more service buildings, more roundabouts, and more ring road segments without forcing you to redesign the network from scratch.
Frequently Asked Questions
What is the best way to start LEGO Skylines service planning on a brand new map?
Lay a compact ring road first, then run electricity and water lines along it before placing a small residential cluster inside the loop. Add one healthcare building and waste collection on the ring so service vehicles travel a short, fast path, and check the demand guide before mirroring that footprint on the opposite side.
How does LEGO Skylines traffic planning interact with pedestrian paths?
Pedestrian paths look like a citizen-friendly shortcut, but they concentrate foot traffic and pull walkers off the avenues that service vehicles rely on. Reserve them for park connectors and never use them to bypass a service road, because emergency vehicles cannot use them at all.
Which service building should I upgrade first in an efficient city?
Upgrade whichever service is closest to its coverage cap, not the one with the tallest demand bar. A bar at 80% signals an overwhelmed healthcare or waste collection building, so add another in the same category on the opposite side of the city. Upgrading under-used services inflates maintenance without improving response time, and the budget hit lingers for months.
How do I tell when demand is about to spike?
Watch the Citizen Age overlay and the population growth rate together. A surge in new adults moving into a fresh residential block almost always pulls healthcare and waste demand upward within two in-game weeks. Pre-stage the next service building during that lag, and you will catch the spike before the demand bar turns red.
Can an efficient city survive with only two hospitals and two fire stations?
Two hospitals and two fire stations can cover a mid-tier LEGO Skylines city only if their service radii leave zero red patches on the coverage map, and your road network carries emergency vehicles without chokepoints. Before adding a third building, revisit the coverage overlay weekly and watch the monthly budget — expand capacity the moment an entire neighborhood goes underserved.